NZS 4203 and the NZGS guidelines for seismic site classification demand a clear picture of subsurface stratigraphy before any major structural design in Whanganui. Simply put, a standard borehole log or test pit only tells you what is directly beneath the drill bit. Seismic tomography (refraction/reflection) bridges that gap by generating a continuous velocity model between and below investigation points. In a city built on the terraces of the Whanganui River, where Quaternary alluvium sits over Tertiary marine sediments, velocity contrasts between gravel lenses, soft pumiceous silts, and the underlying papa rock can vary by an order of magnitude. Mapping those transitions accurately is what separates a conservative, cost-effective foundation from an over-designed or, worse, under-informed one. The data feeds directly into seismic microzonation studies and provides the shear-wave velocity profiles required for site-specific response analysis.
A 2D velocity cross-section reveals buried paleochannels and the papa rock interface that a borehole alone can miss entirely.
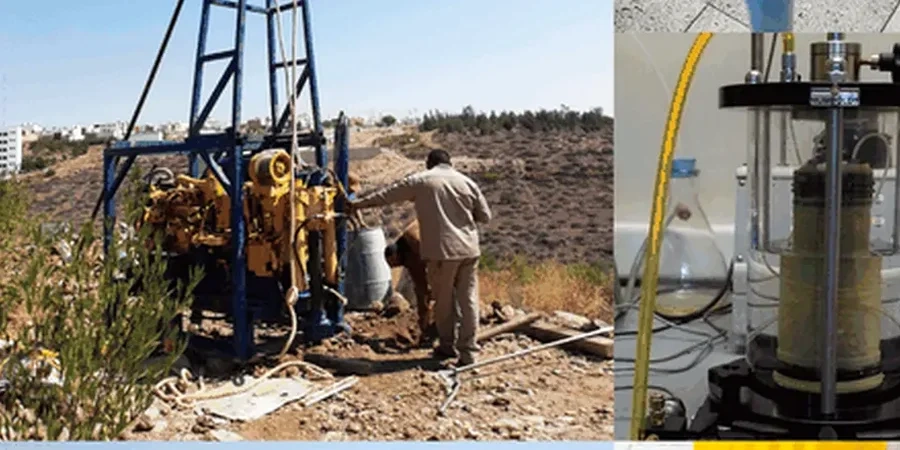
Process and scope
Whanganui’s development since the 1840s has seen the city expand from the river port across a complex sequence of fluvial terraces, Holocene dunes, and loess-covered hill slopes. This patchwork geology means two sites less than a kilometre apart can have fundamentally different seismic responses. Our approach to seismic tomography in Whanganui uses a combination of P-wave refraction and high-resolution reflection to image the subsurface from the near-surface weathered zone down to depths of 30 metres or more, depending on the energy source. The data acquisition uses a 24-channel seismograph with geophone spacings optimized for the target depth, typically 2 to 5 metres for shallow high-resolution work. Processing then applies tomographic inversion algorithms that honour first-arrival travel times and reflected phases, producing a 2D velocity cross-section. For deeper bedrock mapping, particularly where the papa rock interface is suspected below 20 metres of alluvium, reflection techniques with a weight-drop source often prove more effective than refraction alone. This geophysical data, when correlated with a
CPT test or targeted borehole, delivers a solid ground model that satisfies the requirements of NZS 3404 for seismic design parameters. The resolution achievable allows us to delineate buried paleochannels, a common feature in the Whanganui floodplain, which can pose differential settlement risks if undetected.
Local geotechnical context
The Whanganui Basin is a subsiding forearc basin with up to 4 km of Plio-Pleistocene sediment fill. Near the surface, the city sits on a patchwork of Holocene alluvial gravels, interbedded pumiceous sands, and the cohesive but erodible papa (mudstone). A key risk is the misidentification of the engineering bedrock interface: weathered papa can yield seismic velocities indistinguishable from dense gravels in a simple refraction interpretation, leading to an overestimation of site stiffness. More critically, undetected loose, saturated sand lenses within the alluvial sequence at depths of 3 to 10 metres pose a liquefaction hazard under the design earthquake loading for a region with a moderate-to-high seismic hazard factor. Without tomographic imaging, these lenses can be easily missed by widely spaced boreholes. The data from seismic tomography directly constrains the liquefaction assessment by providing the continuous stratigraphic framework needed to identify and delineate potentially liquefiable layers, ensuring that any subsequent densification or stone columns treatment is targeted precisely where it is needed.
Quick answers
What is the typical cost of a seismic tomography survey in Whanganui?
For a standard refraction tomography line of 50 to 120 metres, configured for depths of 20 to 30 metres, the cost in the Whanganui region typically ranges from NZ$4,550 to NZ$9,800. The final price depends on the line length, the required penetration depth—which dictates the energy source and geophone spacing—and the number of lines needed for a pseudo-3D model. A site-specific quote is always prepared after reviewing the project location and objectives.
How does seismic tomography improve site classification compared to just drilling a borehole?
A borehole gives you a one-dimensional log at a single point. Seismic tomography provides a continuous two-dimensional velocity cross-section between points. In Whanganui, where buried paleochannels and lateral variations in alluvium are common, a borehole spaced every 20 metres can miss a soft channel completely. Tomography images the lateral continuity of layers and directly measures the shear-wave velocity profile, removing the need to infer dynamic soil properties from SPT N-values alone, which can be unreliable in pumiceous soils.
What surface conditions are required to run a seismic survey line?
The method requires a relatively clear, linear transect of 50 to 120 metres for the geophone spread. Hard surfaces like asphalt or concrete are not a problem; we use base plates to couple the geophones. The main constraints are accessibility for the cable and source—a weight drop or sledgehammer—and avoiding excessive ambient noise from heavy traffic or industrial machinery during the recording window. On sloped sites, such as the Durie Hill escarpment, we can adapt the survey geometry to follow the topography, and the tomographic inversion naturally accounts for the elevation changes.